Example Report Files to Download
This page contains a number of example .pbix files to download. Examine how the sample reports have been constructed to help understand how to configure Icon Map Pro for your own use cases.
AppSource Sample File
This is the Sample file provided on AppSource when you download Icon Map Pro. It has many different examples on how to configure Icon Map Pro for:
- Reference Layers
- Network Maps
- Shapes with Drill-down to Circles
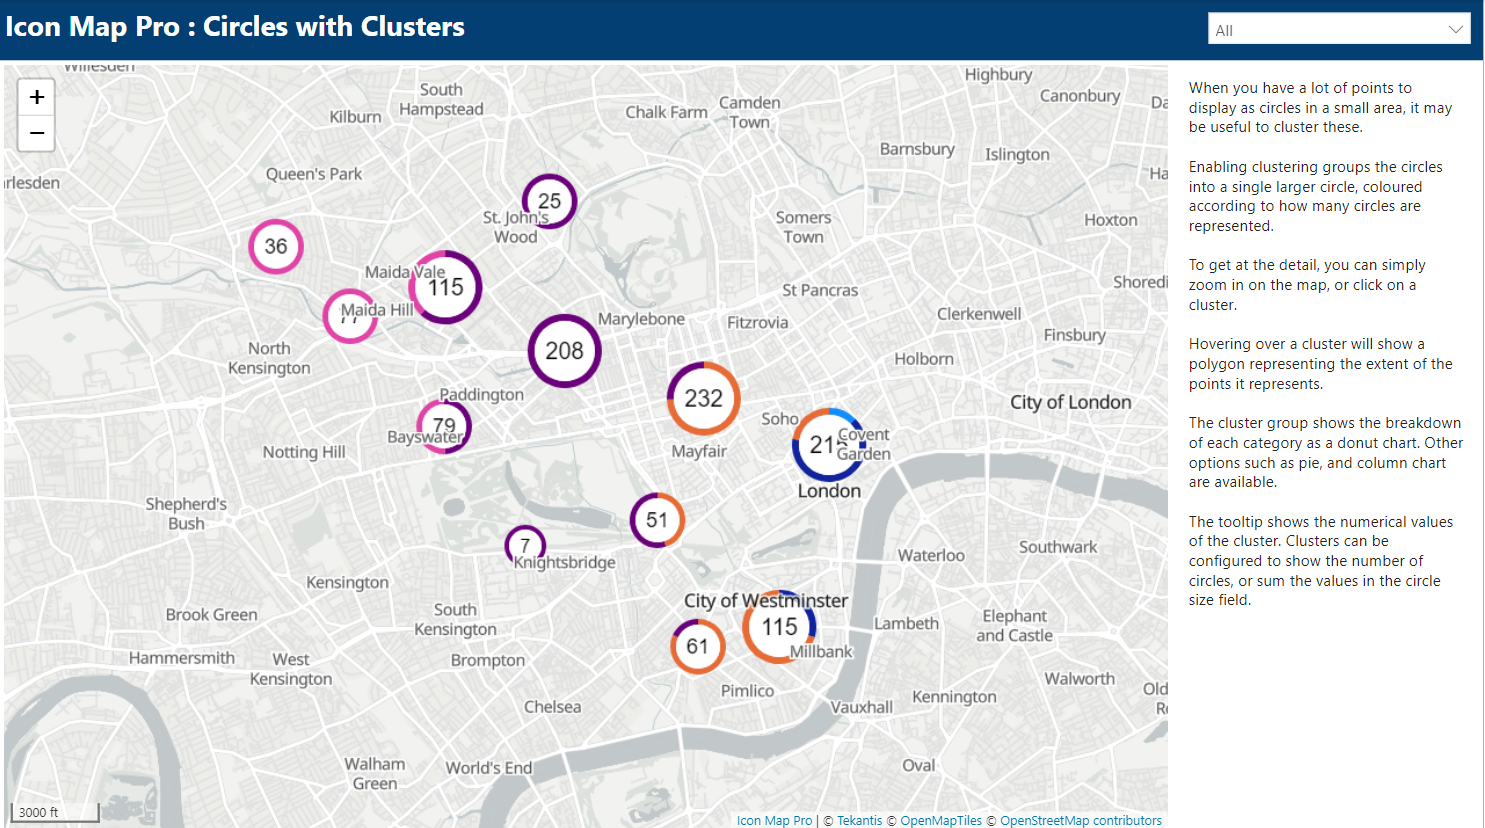
- Circles with Clusters
- H3 Cells
- Heatmap
- Images
- Shapes
- Lines
- Indoor Maps
Circles and Lines
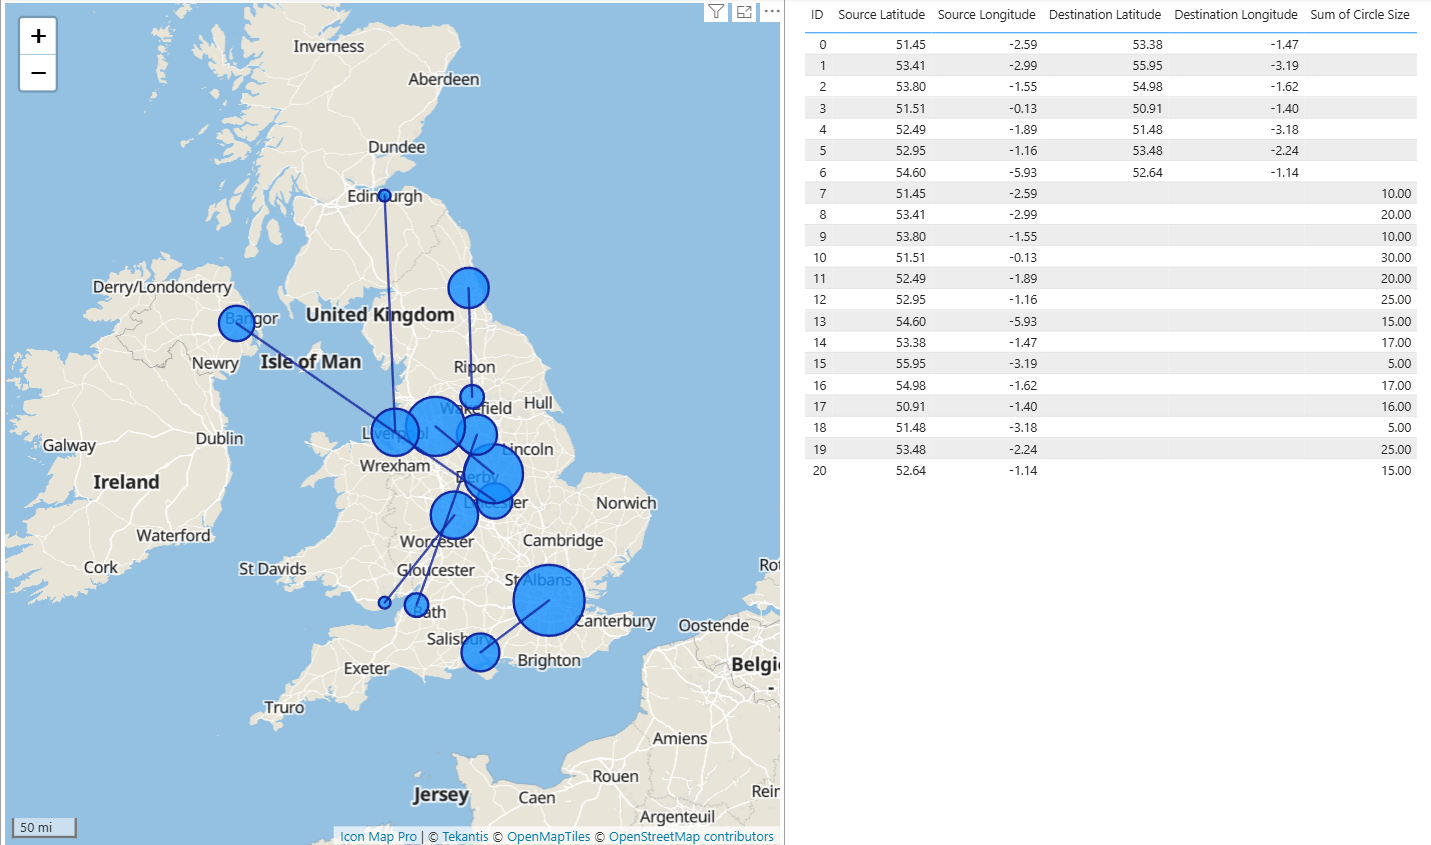
This report shows the two approaches for drawing circles and lines on the same map.
Drill-Down Choropleth Map
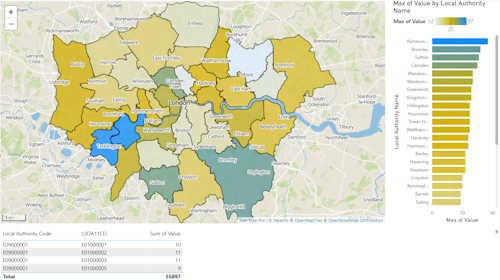
This map contains a shape map with two levels of detail. Drill down from level to the next. A tooltip is provided using a DAX Measure to return the highlighted area's name according to the current drill-down level.
Choropleth Map with Circles Overlaid
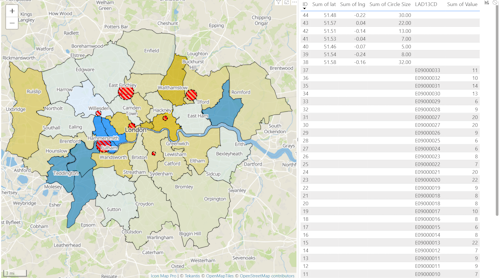
This map contains both a shape map and circles.
H3 Cells derived from Longitude and Latitude
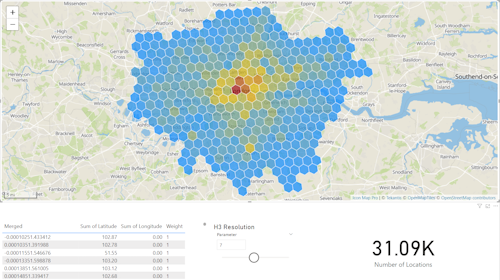
This example generates H3 from over 30 thousand data points. The resolution is set dynamically by a Power BI slicer.
H3 Cells from H3 Cell Indexes with ability to Drill-Down through multiple resolutions
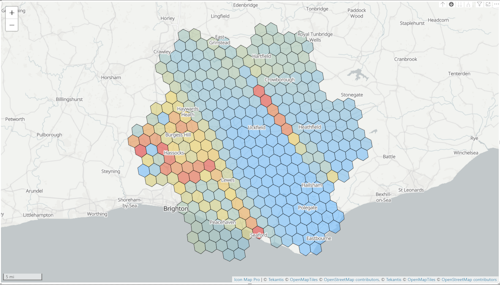
This example displays H3 Cells using the H3 indexes as hex codes. The data contains multiple indexes at different resolutions allowing drill-down to be configured.
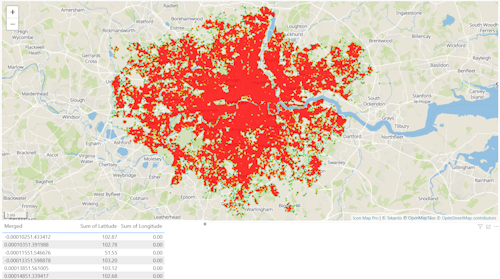
Heatmap
This map shows a heatmap constructed from over 30 thousand Longitude and Latitude coordinates.
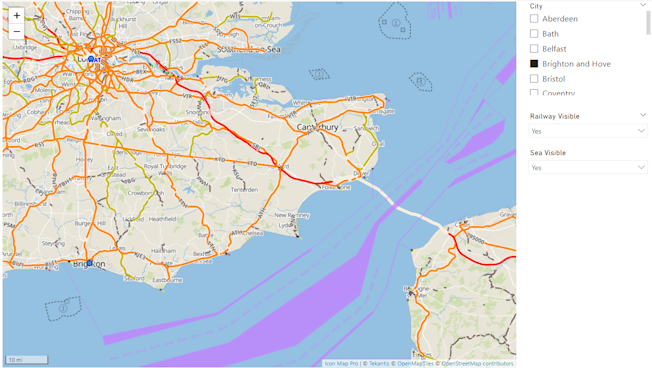
Switchable Raster Overlays
This example shows different techniques to switch between raster overlay layers.
More examples to follow soon...