User Driven Format Rules
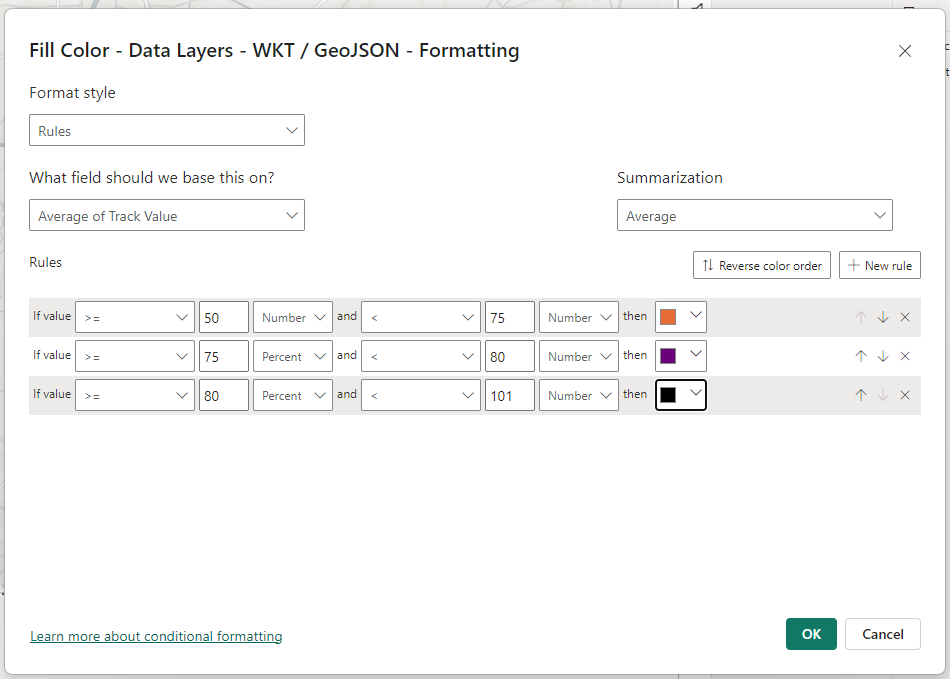
We had an interesting support request come through yesterday from a customer. They were using Power BI's rule based conditional formatting to specify line colours based on values associated with those lines:

However, the report viewers - the end users - had requested to be able to not only specify their own colours, but also the value ranges at which they take effect.
I was keen therefore to see if we could build that kind of capability using standard Power BI visuals. To achieve it I created a set of tables containing colour values for each of the ranges, and a set of corresponding numeric range parameter tables. The result is that the users can press a Power BI button to show the controls. 3 slider slicers allow them to enter the numeric ranges from which the colours take effect, and I used the new card slicer visual to allow them to pick from a set of colours.
A DAX measure is then used to return the appropriate colour based on the slicer selections and the value associated with the line
Track Colour =
VAR _TrackValue = AVERAGE(Track[Track Value]) * 100
VAR _Colour = IF (
    ISBLANK(_TrackValue), "#000000",
    IF (_TrackValue < 'Range 1'[Range 1 Value], MAX ('Colours 1'[Selected Colour]),
        IF (_TrackValue < Range2[Range2 Value], MAX ('Colours 2'[Selected Colour]),
            IF (_TrackValue < Range3[Range3 Value], MAX ('Colours 3'[Selected Colour]),
                MAX ('Colours 4'[Selected Colour])
    ))))
RETURN _Colour
Here's the final report. Feel free to download the pbix file and deconstruct it.
