
2 posts tagged with "iconmappro"

View All Tags

PMTiles arrive in Icon Map Pro

· 4 min read
James Dales
Co-founder of Tekantis

We’re submitting the next version of Icon Map Pro to Microsoft today for publishing on AppSource in a couple of weeks. I’m quite excited about this release for a number of reasons, but one of the main ones is our initial support for PMTiles.

I’ve recently been working with a customer who needed to create a choropleth (filled) map for Canada. Canada is a challenge as it has the largest coastline of any country, but really compact population centres, meaning that to represent census boundaries, we need to be able to plot very large polygons with a detailed coastline, whilst at the same time, really small polygons that might only cover a few blocks in a city centre.

alt text

In terms of doing this in Power BI, we’re unable to use a GeoJSON or shape file as they’re either too large – or once simplified, lose too much definition. As an example, the official GeoJSON file for Canada’s dissemination areas is over 1gb – far too large to import into a Power BI report by some orders of magnitude.

My normal recommendation in these cases is to use Well-Known Text (WKT) shapes loaded into the map via Power BI data model. But Power BI has a maximum number of characters limit that, even with the usual workarounds, is not enough to accommodate some of Canada’s largest territories and provinces.

This doesn’t mean it’s not possible to achieve already with Icon Map Pro though. We can use vector tiles to only retrieve the shapes that need to be displayed on the part of the map that we’re looking at, and at a resolution appropriate for the current zoom level. The issue with vector tiles is that they needed to be either pre-processed, and/or served using a GIS server. This could be an enterprise GIS solution such as Esri’s ArcGIS, an online provider such as Mapbox or an opensource server such as GeoServer. All provide workable solutions, but it’s an additional provider, and sometimes significant cost to add to the mix.

Enter PMTiles. PMTiles provides a new cloud-native way to serve vector (or raster) tiles. Designed to use a highly efficient compression algorithm, the resulting PMTiles file is a single file that sits, usually in cloud storage. It requires a server that supports HTTP range requests – supported by Azure Blob Storage and Amazon S3 buckets. Rather than the whole file being downloaded each time, HTTP range requests are used to download just the segment of the file for that tile. And the file sizes are much smaller than the original – meaning storage costs are minimal – and there’s no compute costs. No GIS server required. Canada’s 1gb dissemination areas file is less than 100mb as a PMTiles file.

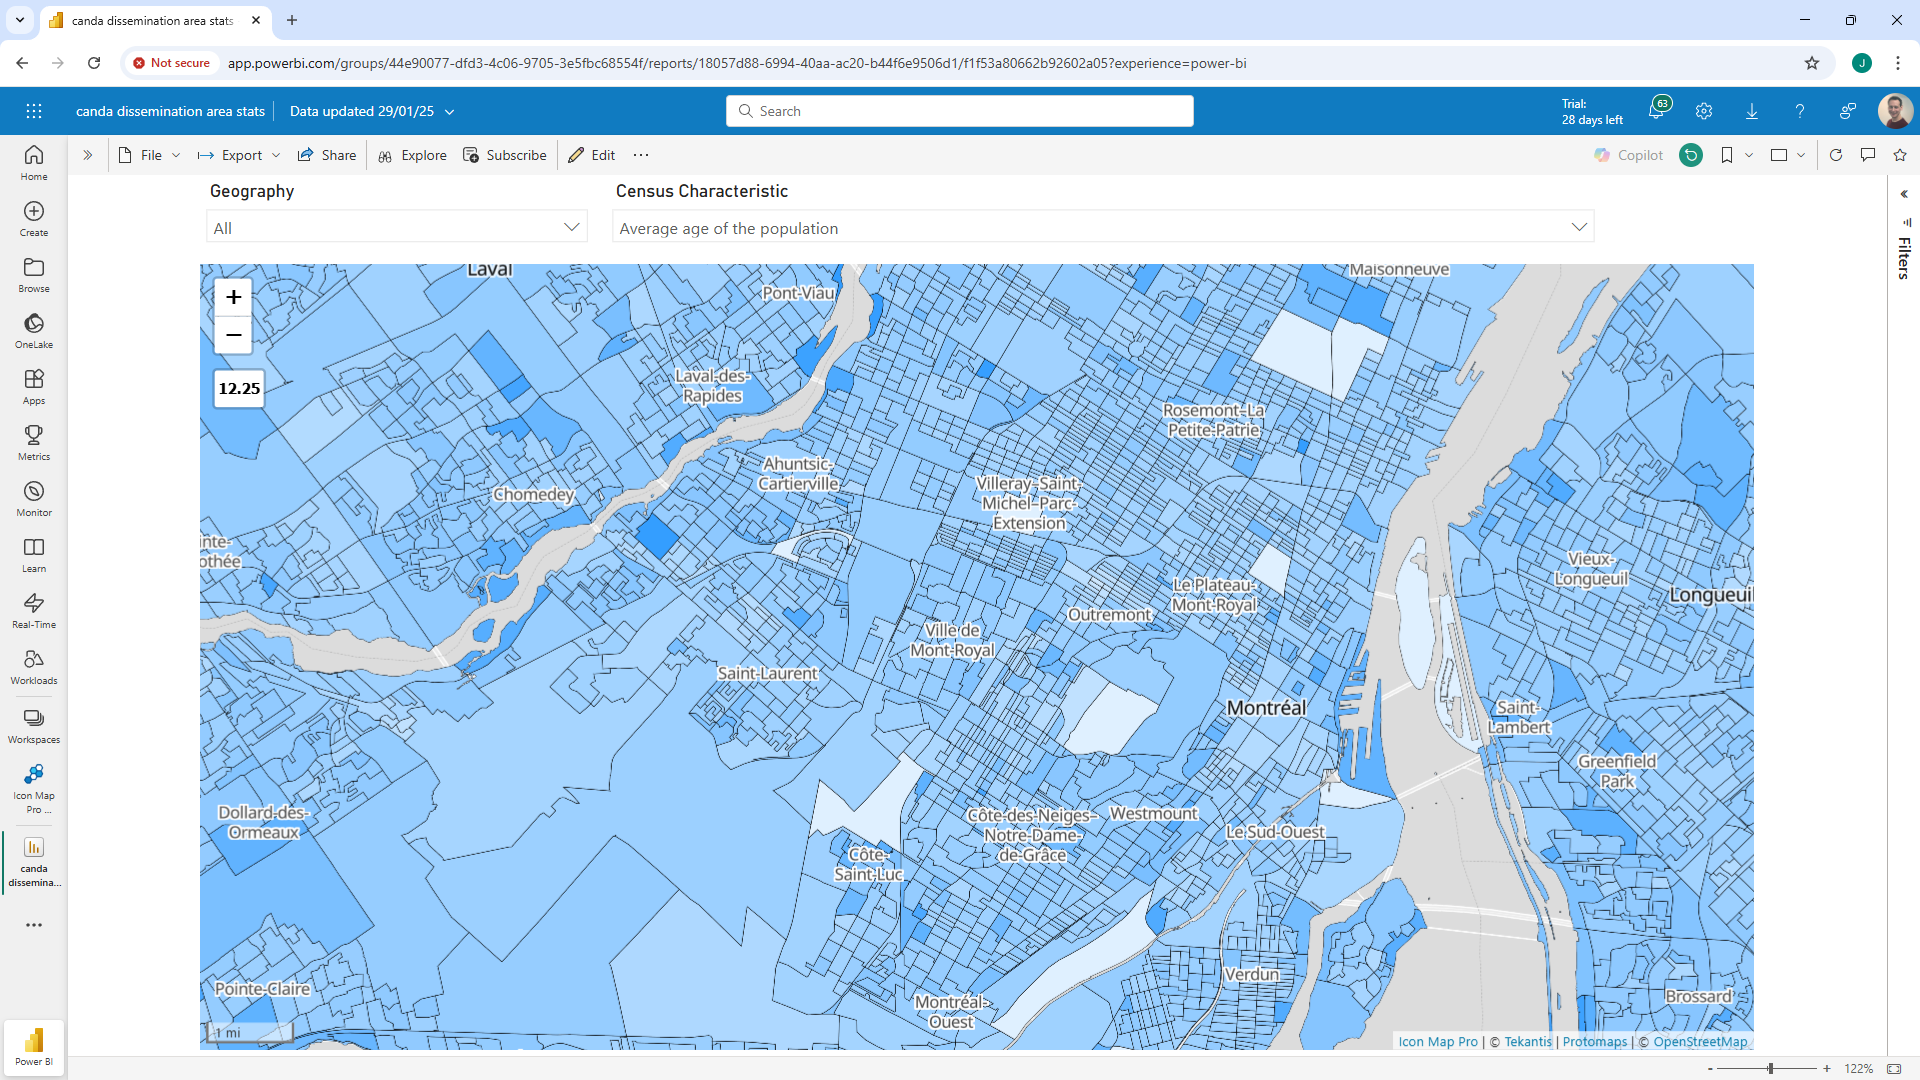
This Power BI report, uses 4 levels of drilldown to present Canada’s census data from Territory/Province level, through Census Divisions, Census Sub Divisions to Dissemination Areas. As well as simply displaying the file, in Power BI we use the embedded properties to link it back to the data in Power BI data model, and use conditional formatting to create our filled, choropleth map on the fly. We’re able to either drill into each area at a time, or simply view all 75,000 dissemination areas at the same time.

And that's not our only use for PMTiles, we've also added some additional background maps thanks to Protomaps.

To create the PMTiles files used in this report, I used the open-source tool, Tippecanoe, but we’re working on building a Microsoft product range that will incorporate this capability, to make it easy to generate your own PMTiles in future. Watch this space - there's so much more coming!

WebGL Mode – what’s it all about?

· 4 min read
James Dales
Co-founder of Tekantis

In our February release of Icon Map Pro, you’ll notice a new settings option, “Rendering”, so I thought I’d explain in more detail what’s behind this option, and why it’s there.

Let’s start by explaining a bit more about the code libraries that Icon Map Pro uses to draw the map. If you go back to when I first created the original Icon Map visual nearly 10 years ago, there were 2 main opensource libraries used for creating web maps, OpenLayers and a more lightweight library, Leaflet.

The original Icon Map was built on top of Leaflet, which provided great support for most of the features required for mapping in Power BI. It also had a wide range of plugins available which added some of the more advanced capabilities.

At Tekantis, when we started to write Icon Map Pro last year, we didn’t want to provide fewer capabilities than were available in the older Icon Map visual, so again we chose Leaflet to ensure we were able to provide the full range of features.

However, Icon Map Pro is capable of drawing more rows of data than the original visual, which was limited to 20,000, then later 30,000 rows. When drawing large amount of complex objects, or images on the map, Leaflet starts to suffer from performance issues. We therefore started to look at how to overcome this.

A lot has happened in the web mapping world in the last 10 years. Volodymyr Agafonkin, who created the original Leaflet library, started to work for Mapbox and created a new map library that was built using WebGL rendering, using the power of the GPU for better performance. Whilst this library was initially open source, at some point Mapbox forked the library to create version 3, after which a Mapbox license key was required to use it.

The version 2 library became the Maplibre project and development of this library has continued separately to the Mapbox library. It’s this Maplibre library that is the foundation for many other mapping libraries such as the Azure Maps JavaScript API.

In Icon Map Pro we’ve been using a plugin that uses Maplibre on top of Leaflet to provide some of the features such as our vector tiles based background mapping. We’ve also provided some experimental layers using WebGL to provide better performance for rendering large GeoJSON layers for example. However, using this plugin has limitations as each layer using WebGL created a separate instantiation of Maplibre and WebGL, and we therefore started to hit limitations in regard to the number of WebGL instances possible, and in terms of memory.

In the February release of Icon Map Pro, we’re removed the experimental WebGL options (for new maps) and replaced them with a new WebGL rendering option. This now uses a single Maplibre instance to draw all the overlay and data-bound layers, which means we don’t hit the same limitations. It’s also enabled some additional functionality where items overlap on the map, such as combined tooltips.

To enable this, we’ve made it a single choice between using WebGL via Maplibre vs traditional rendering via Leaflet. In this initial release, not all overlay and data-bound layer types are available, but we’re planning to enable all of them going forward.

Currently we’re still using the Maplibre plugin for Leaflet, so all the current controls are available. The downside of this however, is that additional features such as the ability to rotate and tilt the map are not available, as these aren’t supported by Leaflet.

In a future release, we’re aiming to provide an additional option that will only use Maplibre, and we can therefore add these additional capabilities.