Circles
Icon Map Pro provides the ability to draw circles on the map.
Data configuration
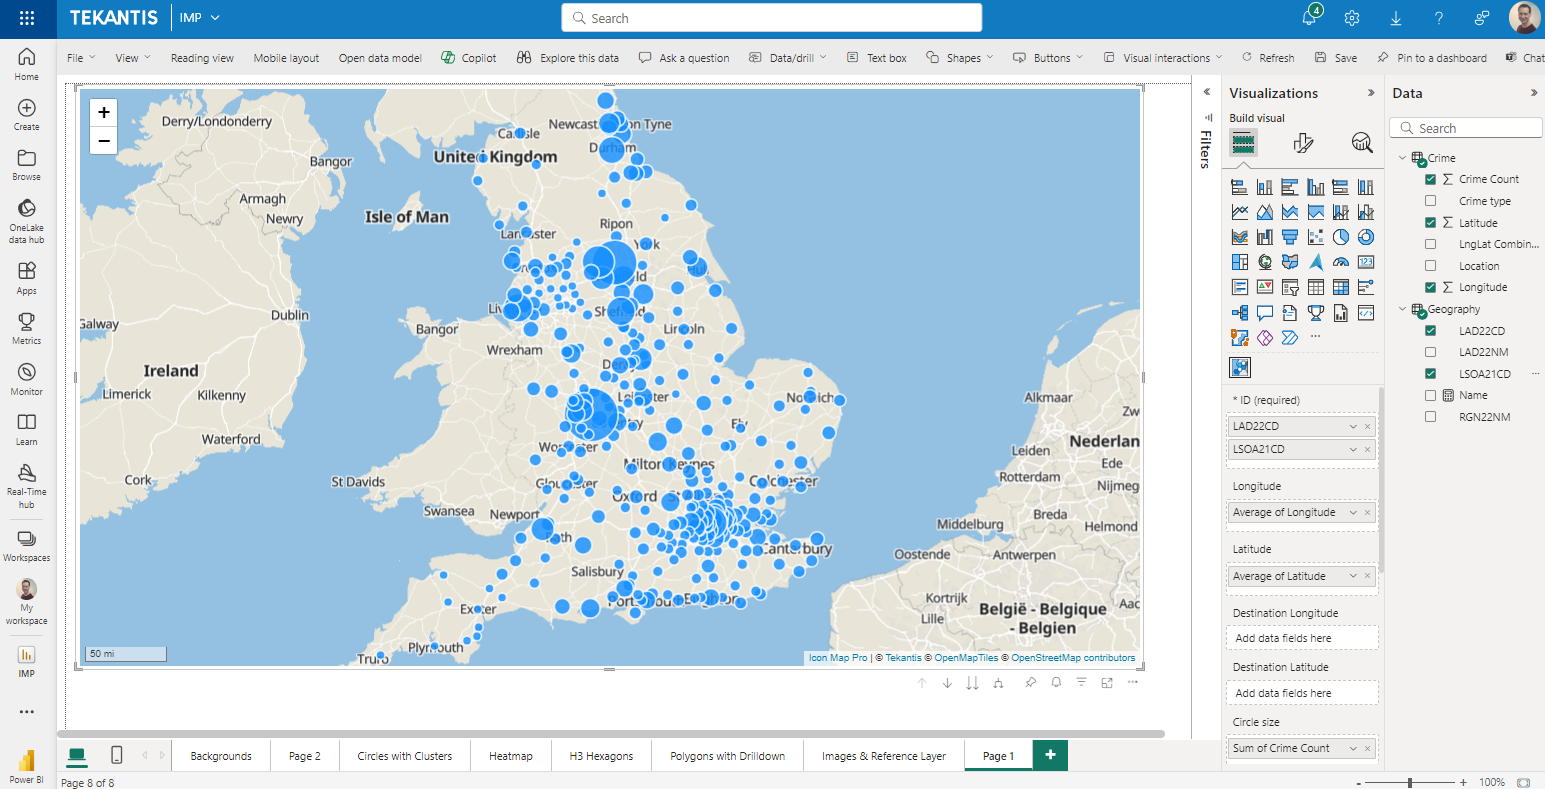
To draw circles, the following fields must be configured:
- ID - A unique ID representing that location. This field can contain more than one value to generate a drill-down hierarchy.
- Longitude (with aggregation type Average)
- Latitude (with aggregation type Average)
- Circle Size - a numeric value determining what size to draw the circle
- Cluster Group (optional) - a description determining used in clustering (WebGL rendering only)
Sample data
| ID | Longitude | Latitude | Destination Longitude | Destination Latitude | Circle Size | Cluster Group | H3 Weight | Heatmap Weight | Image / WKT / GeoJSON | Feature Reference | Feature Weight |
|---|---|---|---|---|---|---|---|---|---|---|---|
| Circle1 | -2.576 | 51.481 | null | null | 50 | cluster 1 | null | null | null | null | null |
| Circle2 | -2.576 | 51.481 | null | null | 50 | cluster 2 | null | null | null | null | null |
| Circle3 | -2.955 | 51.332 | null | null | 100 | cluster 2 | null | null | null | null | null |
| Circle4 | -2.155 | 51.632 | null | null | 100 | null | null | null | null | null | null |
Circles Configuration
In the Data Layers card of the formatting options, ensure that "Circles" is enabled. This will then show the Circles Configuration and Circles Formatting cards.
Size Behavior
The size behavior dropdown has three options that determine how the circles are drawn.

- Relative - The circles will be drawn between the Minimum Size and Maximum Size options. The lowest value in the dataset will be minimum size, and the highest value will be the maximum size, with values scaled in between.
- Size in pixels - The circles will be drawn with a diameter in pixels based on the value in the size field. The circles will appear to stay the same size as the map zooms in and out.
- Size in meters - the circles will be drawn with a diameter in meters on the underlying map, based on the value in the size field The circles will appear to get bigger and smaller as the map zooms in and out.
Include in Auto-Zoom
Include these items when auto zooming. Auto zoom scales the map to fit all of the data-bound objects with this value set to Yes. You can use conditional formatting to set this on a row by row basis by providing a field value or measure with the values of yes or no.
Include tooltip
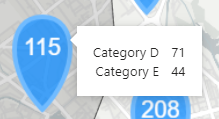
Whether to show a Power BI tooltip for this circle.
Selectable
Whether the circle can be selected to filter or cross-highlight other visuals, or to trigger drill down or drill through functionality.
Z-Index
Determines the order that this layer appears vs other layers. The higher the number, the nearer the forefront this layer will be.
Minimum Zoom
The zoom level at which circles will appear
Maximum Zoom
The zoom level at which circles will stop appearing
EPSG (Coordinate Reference System)
Allows you to specify a specific reference system for your coordinates. The default used is EPSG:4326 / WGS84 and expects longitude and latitude coordinates. You can use other coordinate systems by specifying the relevant EPSG number. For example, to use British National Grid coordinates, enter 27700. Other EPSG codes can be found here.

Clustered Circles Configuration
Enabling this option clusters nearby circles into a single circle, with a number representing how many circles have been consumed. Clusters are color coded into three categories representing the amount of circles consumed. Hovering over the the cluster will show a polygon representing the extent of the consumed circles.
There are two modes for clustering depending on whether WebGL rendering is enabled.
Without WebGL Rendering
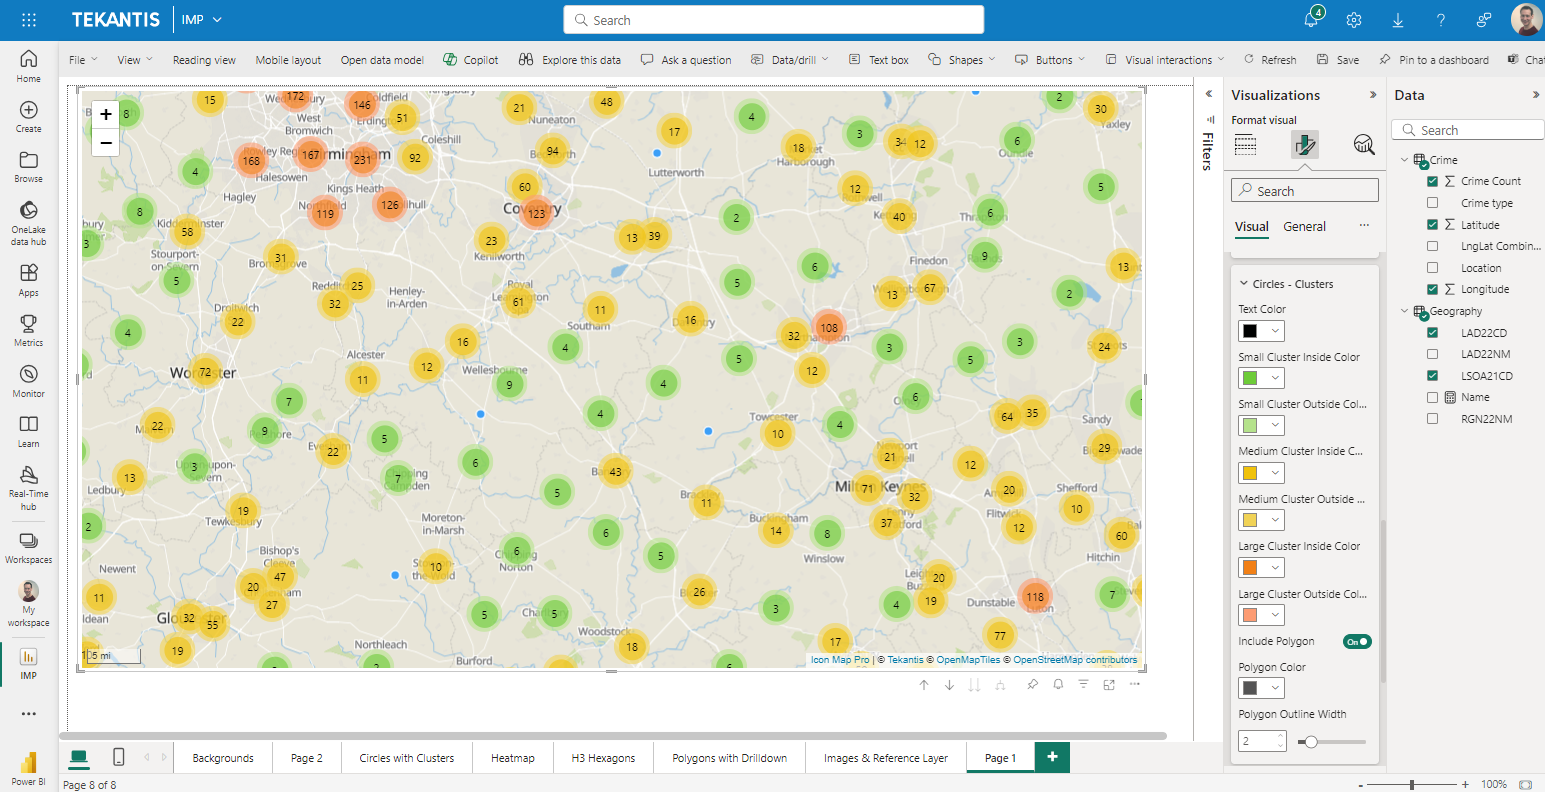
A new formatting card is shown with the following options:
- Text color - the color of text in the clustered circles
- Small Cluster Inside Color - the fill color of the clusters with the smallest number of consumed circles
- Small Cluster Outside Color - the outline color of the clusters with the smallest number of consumed circles
- Medium Cluster Inside Color - the fill color of the clusters with the middle number of consumed circles
- Medium Cluster Outside Color - the outline color of the clusters with the middle number of consumed circles
- Large Cluster Inside Color - the fill color of the clusters with the largest number of consumed circles
- Large Cluster Outside Color - the outline color of the clusters with the largest number of consumed circles
- Include Polygon - whether to show the polygon representing the extent of the consumed polygons
- Polygon Color - the color of the polygon
- Polygon Outline Width - the width of the polygon outline
With WebGL Rendering
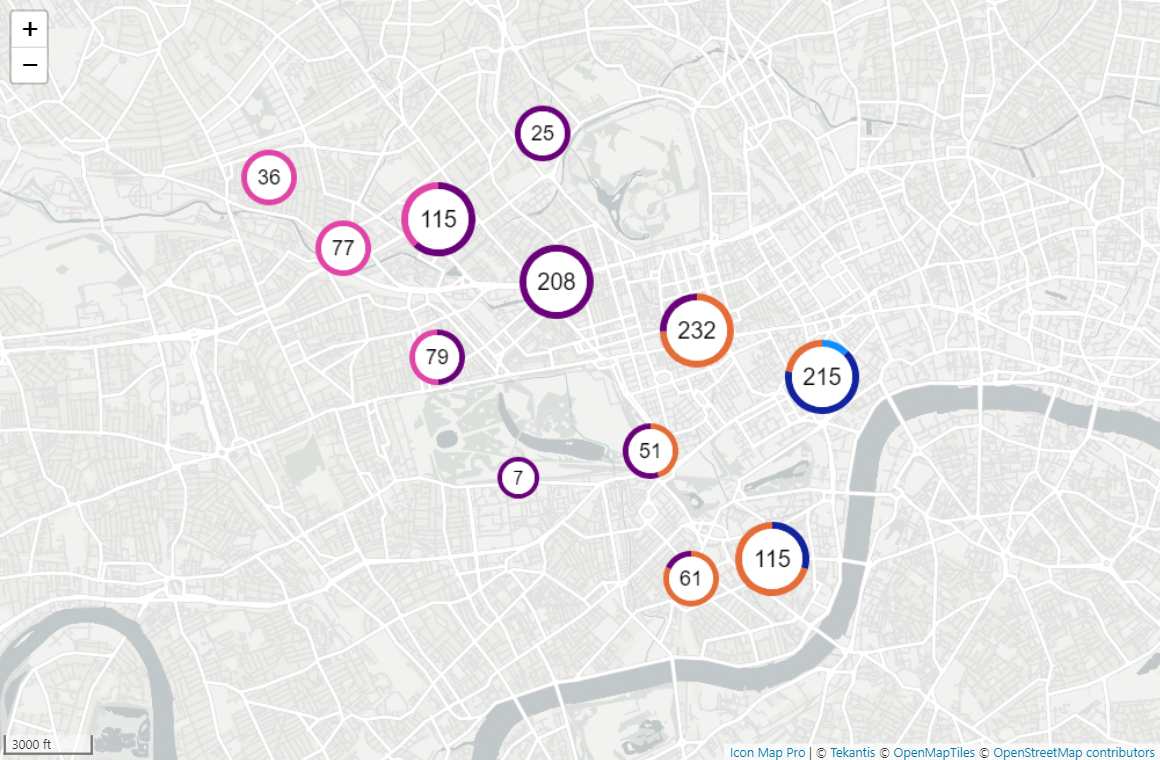
With WebGL rendering enabled, clusters are able to be rendered showing different categories using the Cluster Group field, although this is not required to use clustering.
The Cluster Group does not function in the same way as the legend field in other visuals, as the cluster group can be defined as a measure, which increases flexibility. In order for the correct cluster group to be returned, the ID field must be unique to that longitude, latitude AND cluster group.
With clustering enabled, a new section of the formatting options, Cluster Configuration, is revealed.
Cluster Type
Cluster determines the style of the cluster, and therefore which formatting options are available:
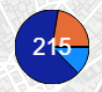
Donut
Donut provides the clustering as a donut chart, with the category colors shown around the edge of the circle.

Where no cluster group is provided, the circle will use the default outline color.
Pie
Pie functions similarly to the donut, but represents the cluster groups in a pie chart.
Bar Chart
The bar chart option, shows the different categories as a horizontal bar chart
Column Chart
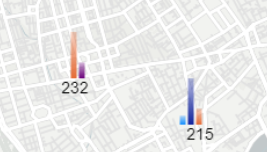
The column chart, shows the categories as a vertical column chart
Square
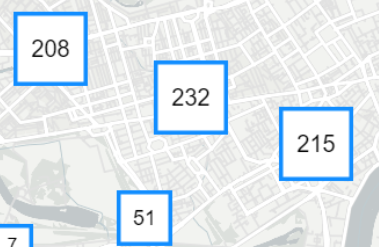
The square option, does not use the cluster group field, and instead draws the clusters as a square.
Teardrop
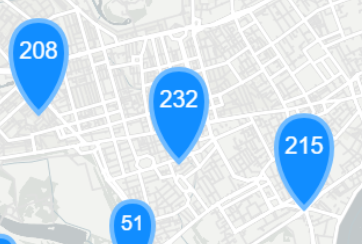
Similar to the square, the teardrop shows the cluster value in a teardrop.
Fixed Size & Fixed Circle Size
This setting determines whether the size of the cluster symbol varies according to the value of the cluster
Background Color (For donut, square & teardrop)
The background color of the cluster symbol
Background Transparency (For donut, square & teardrop)
The background transparency of the cluster symbol
Show Pie Outline (pie chart)
Whether to draw a line around the circle, and in between the pie segments
Pie outline color (pie chart)
The color of the outline
Outline Color (teardrop and square)
The color of the outline
Default Outline Color (donut only)
The color of the outline when no cluster group specified.
Outline Width (Square & Teardrop)
The width of the outline
Show Total
Whether to show the total cluster value
Text Color
The color of the total text
Rounded Bars (bar & column chart)
Whether to draw rounded bars or straight cornered bars
Max bars (bar & column chart)
The maximum number of cluster groups to include in the chart
Bar fade (bar & column chart)
The amount at which the bars fade as a transparent gradient. 0 = solid.
Show Tooltips
Whether to show the cluster group breakdown as a tooltip
Zoom on click
Whether to zoom into the extent of the cluster when clicked on
Select on click
Whether to select all of the items in the cluster when clicked. Large clusters may take time to select all items.
Minimum Points to Cluster
The number of circles to draw before including them in a cluster
Cluster radius
The size of the area to be considered for each cluster
Max Cluster zoom level
The zoom level to stop drawing clusters. Beyond this zoom level, only individual circles will be drawn.
Use values in circle size field as counts
When enabled the text in the cluster will sum the circle size values for all the circles included in the cluster. When disabled, it will show the number of circles included in the cluster.
Include Polygon
Whether to draw a polygon showing the extent of the circles included in the cluster. This is shown when the someone hovers the mouse over a cluster.
Polygon Color
The color of the polygon
Polygon Outline Width
The size of the polygon border
Cluster Colors

This section is used to display the cluster values, to assign colors to them. If there are large numbers of cluster groups, you may need to filter the report temporarily to assign colors as only 10 are shown at a time in the formatting pane.
Circle Formatting Options
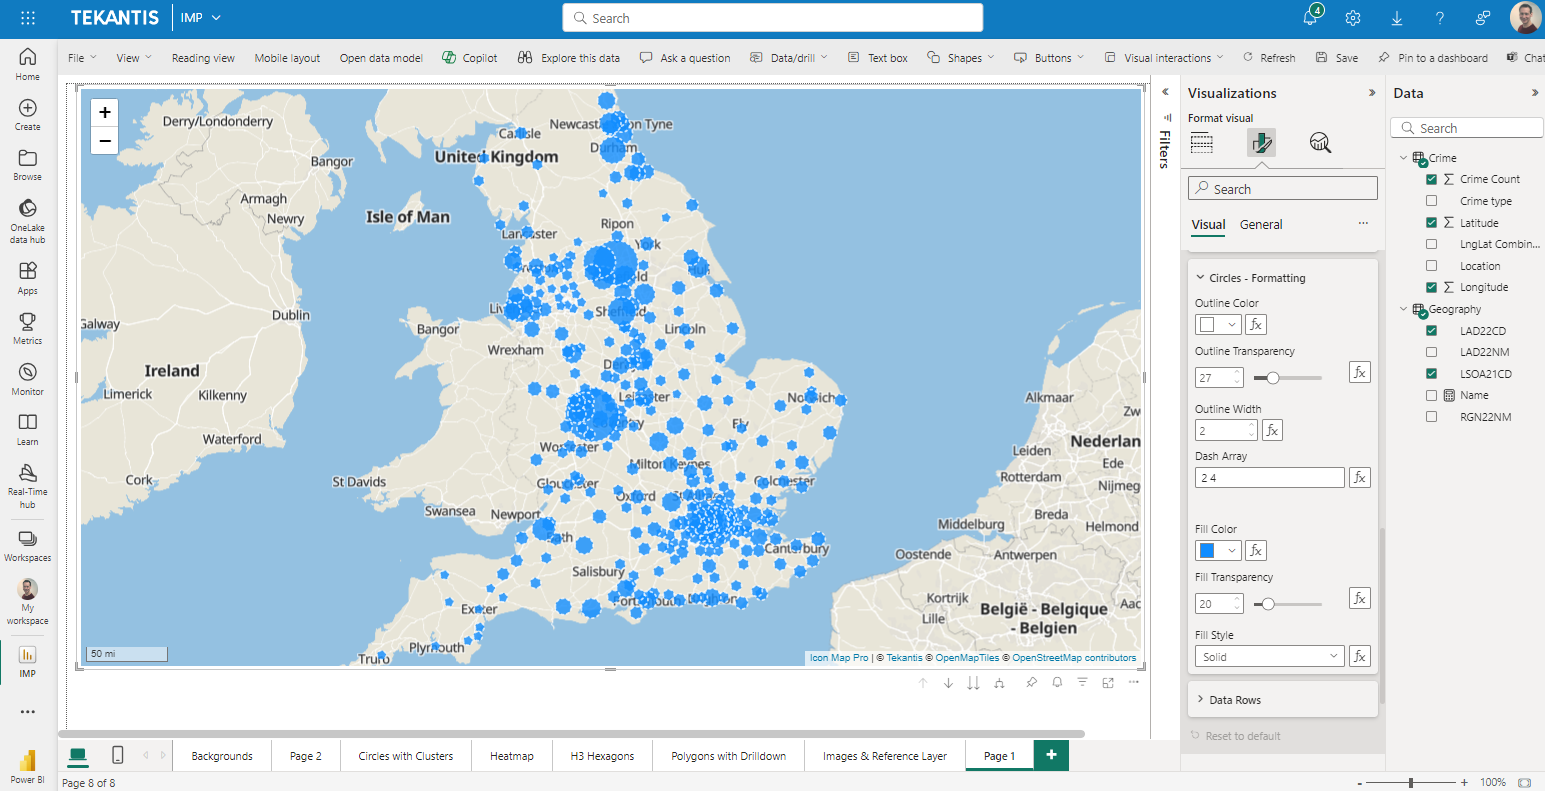
The following options are available for formatting circles. All options are configurable through Power BI conditional formatting if required.
Outline
- Outline Color - the color of the circle outlines.
- Outline Transparency - a number between 0 and 100 representing the transparency of the outline.
- Outline Width - the number of pixels wide to draw the outline. This can be a decimal number.
- Dash Array (not available with WebGL). The dash array determines the pattern used for the line. It consists of a series of space separated numbers. Each value represents the length along the line that should be painted (the dash) and then not painted (the gap). Eg:
4 4
Fill
- Fill Color set by cluster (webGL rendering only) - when using cluster groups, the circles will use the color of the cluster as the fill color
- Fill Color - the color of the circle fill.
- Fill Transparency - a number between 0 and 100 representing the transparency of the circle fill.
- Blur (WebGL rendering only) - The amount to blur the edge of the circle.
- Fill Style (not available for WebGL rendering)- Whether to use a solid fill, or hatched. Selecting hatched displays the following options:
- Hatch Angle
- Hatch Width
