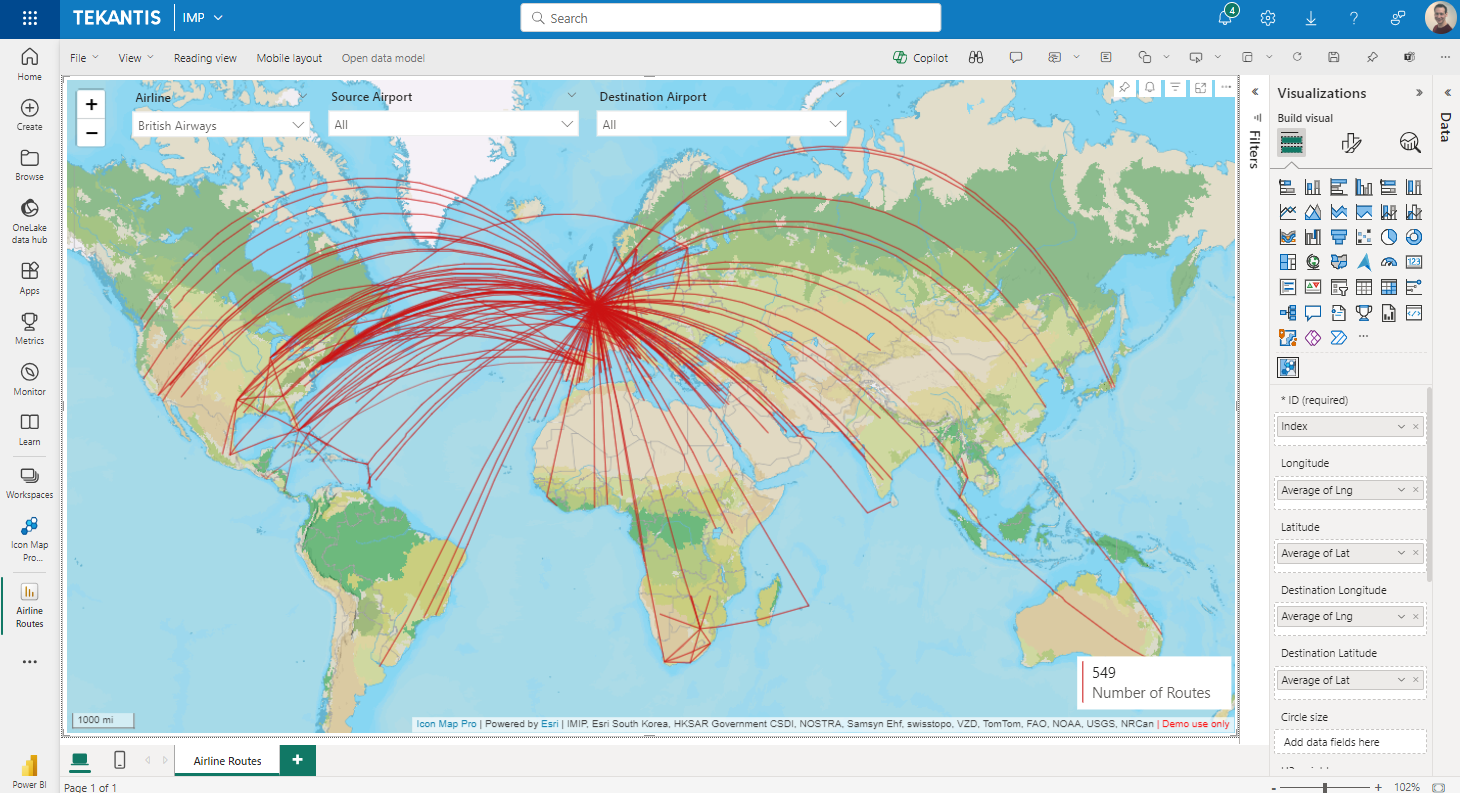
Lines
Draw lines on the map between two sets of longitude and latitude coordinates.
Data Setup
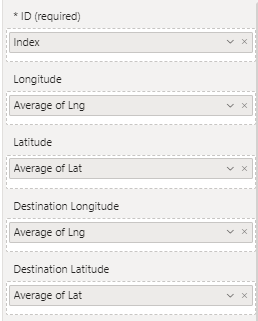
In order to display lines the following fields should be configured:
- ID - a unique ID representing a line
- Longitude - The longitude of the coordinate at the line start
- Latitude - The latitude of the coordinate at the line start
- Destination Longitude - The longitude of the coordinate at the line destination
- Destination Latitude - The latitude of the coordinate at the line destination
It is then necessary to enable the Lines toggle in the "Data Layers" section of the formatting options of the map.
Sample data
| ID | Longitude | Latitude | Destination Longitude | Destination Latitude | Circle Size | Cluster Group | H3 Weight | Heatmap Weight | Image / WKT / GeoJSON | Feature Reference | Feature Weight |
|---|---|---|---|---|---|---|---|---|---|---|---|
| Line1 | -2.576 | 51.481 | 0.153 | 52.187 | null | null | null | null | null | null | null |
| Line2 | -2.576 | 51.481 | -0.180 | 52.331 | null | null | null | null | null | null | null |
When configured, it is possible to draw a circle at the start and/or end of a line. In which case the circle size should also be specified:
| ID | Longitude | Latitude | Destination Longitude | Destination Latitude | Circle Size | Cluster Group | H3 Weight | Heatmap Weight | Image / WKT / GeoJSON | Feature Reference | Feature Weight |
|---|---|---|---|---|---|---|---|---|---|---|---|
| Line1 | -2.576 | 51.481 | 0.153 | 52.187 | 10 | null | null | null | null | null | null |
| Line2 | -2.576 | 51.481 | -0.180 | 52.331 | 20 | null | null | null | null | null | null |
Configuration
There are a number of configuration options available for lines:

Include in Auto Zoom
Whether the start and end of the line should be included in the auto zoom of the map. Can be set to yes or no using conditional formatting to apply to specific lines.
Include Tooltip
Whether to include a tooltip. Can be set to yes or no using conditional formatting to apply to specific lines.
Selectable
Whether the line can be clicked on for interaction with other visuals. Can be set to yes or no using conditional formatting to apply to specific lines.
Include circle(s) at
Enables circles to be drawn at the start, end or both ends of a line. Or neither. When enabled, the circle size should be specified using the "Circle Size" data field. The Circles data layer type also needs to be enabled.
An example file is available showing this approach.
Image at start of the line
It is possible to display an image the start of the line, without having to add it as an image with a separate row in your Power BI dataset.

Image URL at start
Specify an image to display at the line start. This can be hardcoded so that all lines display the same image, or use a DAX expression or field value for different images at each line start. URLs should start https or data. The same rules should be followed as other map images.
Image Width and Height
These settings allow you to set the size of the image and represent the width and height in pixels. This can be hardcoded, or set using conditional formatting from a DAX measure or field value.
Rotation
This should represent a number between 0 and 359 and represents the number of degrees to rotate the image. This can be hardcoded, or set using conditional formatting from a DAX measure or field value.
Transparency
Represents the percentage transparency of the image and should be a numeric value between 0 and 100. This can be hardcoded, or set using conditional formatting from a DAX measure or field value.
Image at end of the line
It is possible to display an image the end of the line, without having to add it as an image with a separate row in your Power BI dataset.
Image URL at end
Specify an image to display at the line end. This can be hardcoded so that all lines display the same image, or use a DAX expression or field value for different images at each line destination. URLs should start https or data. The same rules should be followed as other map images.
Image Width and Height
These settings allow you to set the size of the image and represent the width and height in pixels. This can be hardcoded, or set using conditional formatting from a DAX measure or field value.
Rotation
This should represent a number between 0 and 359 and represents the number of degrees to rotate the image. This can be hardcoded, or set using conditional formatting from a DAX measure or field value.
Transparency
Represents the percentage transparency of the image and should be a numeric value between 0 and 100. This can be hardcoded, or set using conditional formatting from a DAX measure or field value.
Z Index
Determines the order in which layers are displayed. The higher the number, the nearer the foreground.
EPSG (Coordinate Reference System)
Allows you to specify a specific reference system for your coordinates. The default used is EPSG:4326 / WGS84 and expects longitude and latitude coordinates. You can use other coordinate systems by specifying the relevant EPSG number. For example, to use British National Grid coordinates, enter 27700. Other EPSG codes can be found here.

Maximum and Minimum Zoom
The zoom levels between which the layer should be displayed.
Formatting

All line formatting options can be set to apply to all lines, or use conditional formatting to apply values to specific lines.
Color
Color to draw the line
Color Type
Determines whether the color should be a single color or a gradient.
When gradient colors are enabled, it is not possible to set the colors of the lines using conditional formatting.
Only available when WebGL rendering is enabled.
Transparency
A number between 0 and 100.
Width
The line width in pixels. This can be a decimal number to achieve thinner lines.
Line Shape

Lines can be one of the following options:
- Straight - draws a line that appears straight on the map directly between the two points.
- Curved - draws a line that appears curved between the two points.
- Shortest - draws a line that follows the curvature of the earth.
Outline Blur
How much the line should be blurred.
Only available when WebGL rendering is enabled.
Invisible Line Width
Creates an invisible line as well as the visible line when the width is greater than the visible width. A larger invisible width can help when clicking or hovering over narrow lines.
Only available when WebGL rendering is enabled.
Dash Array
The dash array determines the pattern used for the line. It consists of a series of space separated numbers. Each value represents the length along the line that should be painted (the dash) and then not painted (the gap). Eg:
4 4
Please note this capability is not available when WebGL rendering is enabled.
Dash Animation Speed
If a dash array is used to draw a line pattern, it can be animated to show the direction of travel. The speed can be a negative or positive number, such as 10.
Please note this capability is not available when WebGL rendering is enabled.
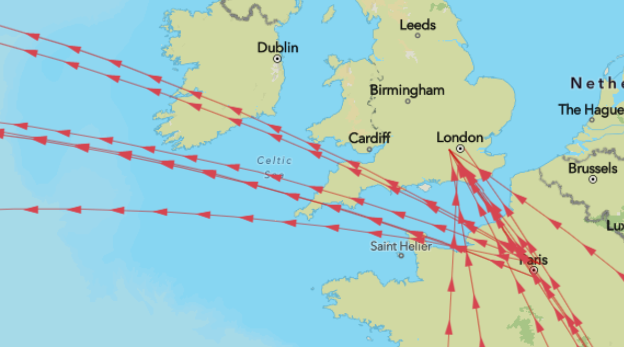
Line Symbols
It is possible to add a symbol along the path of a line. This feature is not available for "Curved" lines, but is available for "Straight" and "Shortest".
Include Line Symbol
Determines whether symbols are displayed. Can be set using conditional formatting values "yes" or "no" to determine the setting for each individual line.
Line Symbol Text
The text/symbol that is drawn along the line. Use Unicode Characters to draw symbols such as planes, arrows etc. Symbols should face towards the right to show in the direction of the line. Use spaces to determine the gaps between. This setting can be determined using conditional formatting to show different text or a different symbol for each line.
Line Symbol Color
Set the color of the symbol or text.
Line Symbol Size
Set the size of the symbol/text in pixels
Line Symbol Orientation
This determines how the symbols are drawn:
- Normal - oriented along the direction of the line
- Flipped - rotated by 180 degrees
- Perpendicular - rotated by 90 degrees
Line Symbol Offset
Ensure your symbols are aligned to the center of the line, or offset below or above. This value can be a negative number to draw text above the line.
Please note this capability is not available when WebGL rendering is enabled.
Line Symbol Repeat
Determines whether one symbol is shown, or multiple. Can be set using conditional formatting using the values "yes" or "no".
Symbol Halo Color
The outline color for symbol text
Only available when WebGL rendering is enabled.
Symbol Halo Width
The width of the halo
Only available when WebGL rendering is enabled.
Symbol Halo Blur
How much the halo should be blurred.
Only available when WebGL rendering is enabled.