Vector Tiles
Vector tiles provide a way of delivering large numbers of shapes on the map. As they are simplified for each level of zoom, they can provide precise coordinates at detailed levels of zoom. Vector tiles contain the geometry, but not information about how those shapes are styled, allowing you to apply formatting based on your Power BI data.
Vector tiles can be generated and hosted in platforms such as GeoServer, Mapbox Studio and ArcGIS. Alternatively vector tiles can be stored in PMTiles format and hosted in cloud storage as a single file, without the need for a GIS server.
Data Setup
In order for Power BI to interact with shapes the following fields must be provided:
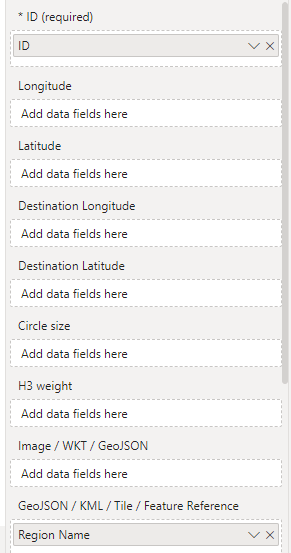
- ID - the unique reference of a feature within your file
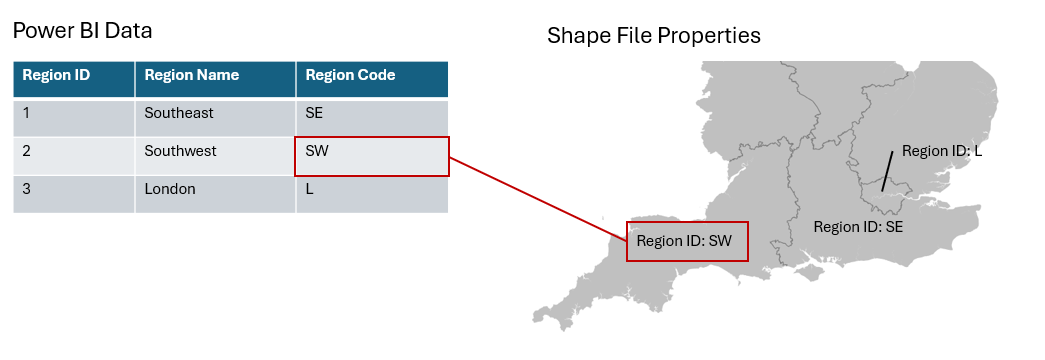
- GeoJSON / KML / Shapefile / Tile / Feature Reference - an item from your Power BI data than can be joined with the value in a property of that feature within tile layer.
Sample data
| ID | Longitude | Latitude | Destination Longitude | Destination Latitude | Circle Size | Cluster Group | H3 Weight | Heatmap Weight | Image / WKT / GeoJSON | Feature Reference | Feature Weight |
|---|---|---|---|---|---|---|---|---|---|---|---|
| 1 | null | null | null | null | null | null | null | null | null | England | null |
| 2 | null | null | null | null | null | null | null | null | null | Scotland | null |
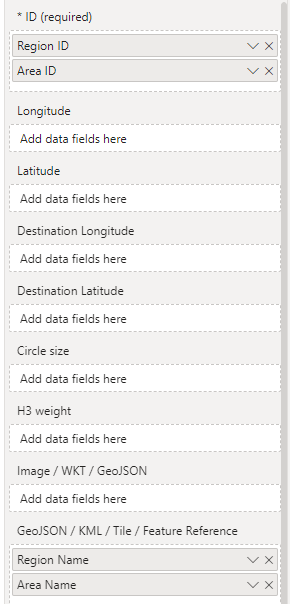
Drill down
It is possible to create multiple levels of vector tile layers, and use Power BI's drill down features to view more levels of detail. Dragging the ID field of the 2nd level down into the ID field well enables drill down within the visual. The "Feature Reference" field well should contain a field to lookup the relating property for each level of drill down.
Sample data
| ID | Longitude | Latitude | Destination Longitude | Destination Latitude | Circle Size | Cluster Group | H3 Weight | Heatmap Weight | Image / WKT / GeoJSON | Feature Reference | Feature Weight |
|---|---|---|---|---|---|---|---|---|---|---|---|
| A1 | null | null | null | null | null | null | null | null | null | Surrey | null |
| A2 | null | null | null | null | null | null | null | null | null | Hampshire | null |
| B1 | null | null | null | null | null | null | null | null | null | Waverley | null |
| B2 | null | null | null | null | null | null | null | null | null | East Hampshire | null |
Auto Zoom
Unlike with other methods of drawing items on the map, Icon Map Pro does not know the locations of the items in the tiles to auto zoom to their locations on the map. The geometry information is only provided when viewing a location on the map, and the tiles for that area are requested and loaded. As a result we need to provide additional information to enable auto-zoom for vector tiles.
There are two approaches that Icon Map Pro uses to enable this.
1 - Provide longitude and latitude coordinates for each feature.
We can either provide the center point of a shape to use for auto zooming, or two sets of coordinates representing the opposite corners of a bounding box. These coordinates are provided to Icon Map Pro using the longitude and latitude fields, and additionally the destination longitude and destination latitude fields for a bounding box.
Using the center point
| ID | Longitude | Latitude | Destination Longitude | Destination Latitude | Circle Size | Cluster Group | H3 Weight | Heatmap Weight | Image / WKT / GeoJSON | Feature Reference | Feature Weight |
|---|---|---|---|---|---|---|---|---|---|---|---|
| A1 | -0.5671 | 51.2472 | null | null | null | null | null | null | null | Surrey | null |
Using a bounding box
| ID | Longitude | Latitude | Destination Longitude | Destination Latitude | Circle Size | Cluster Group | H3 Weight | Heatmap Weight | Image / WKT / GeoJSON | Feature Reference | Feature Weight |
|---|---|---|---|---|---|---|---|---|---|---|---|
| A1 | -0.9002 | 51.4162 | -0.1004 | 51.1304 | null | null | null | null | null | Surrey | null |
2 - Read the tiles in advance to determine locations.
This option is only available when WebGL rendering is enabled.
Instead of providing the bounding box using data from Power BI, Icon Map Pro can scan the map to locate the available features in the tiles. This occurs the first time the map loads and it is then cached within the visual until the page is changed or the report reopened.
For vector tiles using the XYZ URL format, the whole planet is scanned for features using the zoom level selected. The zoom level should be sufficient for all features to be rendered. Please note that if you are using a GIS service that charges for transactions, this process can generate a large number of requests.

For vector tiles using the PMTiles format, a more precise scan of tiles can be performed. The header of a PMTiles file contains the bounding box of the layer, and the zoom level at which all features are rendered. All the tiles at this zoom level are then requested and the bounding boxes cached. If the tiles contain very small, detailed features, this may result in a high zoom level, which may take some time to request all features. The zoom level can be overridden by specifying the max-zoom limit.

Formats - XYZ / PMTiles
Icon Map Pro supports vector tiles in protobuf (pbf) format following the Mapbox Vector Tile Specification. This format is supported of course by Mapbox, but also many other platforms including ArcGIS and GeoServer using the Vector Tiles Extension. These platforms use the XYZ format to divide the earth up into tiles, which are then requested by the zoom level {z} and {x} and {y} coordinates to generate a URL such as https://server/layer/{z}/{x}/{y}.pbf. It is of course also possible to just generate the tiles and host them as simple files on a web server.
As the above approach requires the use of a third-party platform and potentially additional costs or infrastructure requirements, an alternative is to use the PMTiles format. PMTiles also use tiles in the Mapbox Vector Tile Specification, but store them in a very efficient cloud-native format, as a single file. This file can then be hosted on file storage that support HTTP range requests to only serve out the part of the file containing the tile requested. Examples of supported services include Azure blob storage and S3 buckets in AWS. This then provides a very cost effective storage mechanism with no compute costs.
PMTiles can be generated using open-source tools such as Tippecanoe or converted from existing .mbtiles files using the go-pmtiles tool.
Configuration Options
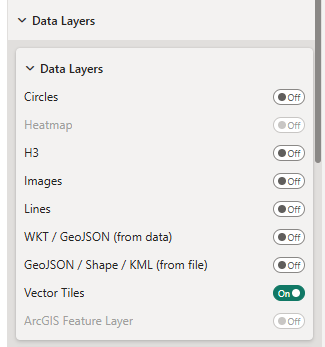
To enable vector tiles, the "Vector Tiles" toggle should be enabled in the Data Layers section of the visual's formatting options.
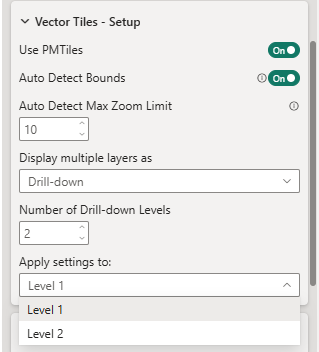
Setup
Icon Map Pro supports the ability to load multiple vector tile layers, either one at a time through Power BI's drill-down functionality, or at the same time as multiple layers. Increasing the number of levels / layers above 1, will show a dropdown box to pick the level the configuration and formatting options apply to.
Vector Tile XYZ URL

This is the URL template for requesting tiles from the server. There are a number of prerequisites:
- Tiles must be served as EPSG:3857
- Tiles must be served as Mapbox Vector Tiles in Protobuf format
- The URL should start https
- The server must be configured for CORS
See the section on URL formats for obtain the correct URL for various hosting options.
Match a Specific Property
When Icon Map Pro draws the features (a point, polygon, linestring etc) from the layer on the map, it tries to match each feature to a row of Power BI data in the "Feature Reference" field. It does this by checking the properties of each feature against the value in each row of data. If features have a large number of properties this can take time. Also if there are conflicts between the values in different properties, it can cause false matches.
To improve performance and avoid false matches it is possible to configure a specific property to check against.

The value in this field should be the name of the property in your layer and is case sensitive.
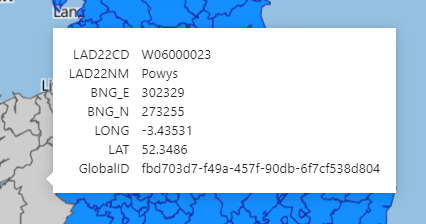
Add Property to Tooltip
Not available with WebGL rendering
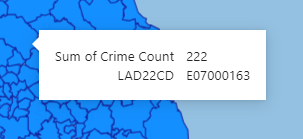
This provides a convenient way of adding the join field to the tooltip.
Add All Properties to Tooltip
Not available with WebGL rendering
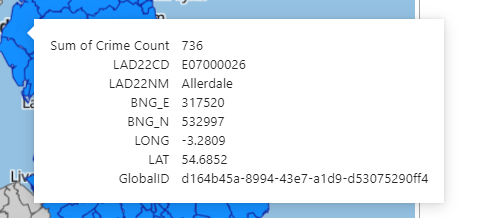
This will add all the features of matched shapes to the tooltip.
Add Tooltips to Unmatched Shapes
This will add tooltips exposing the properties of unmatched shapes. This is also useful for debugging your shapes if matching is not occurring as you expect.
Include in Auto Zoom
Whether this feature should be included when zooming the map to features referenced in the data.
Selectable
Determines whether these items can be selected to cross-filter or highlight other visuals on the Power BI report. This can be configured using conditional format to specify this option an a row by row basis.
Layer Name(s)
Some vector tile sources may have multiple layers. For example a source may contain polygons and the polygons' centroids as separate layers within the same source. It is possible to specify the layer to include by specifying its name. Multiple layers can be listed separated by commas. Leaving this setting blank will result in all layers being included.
Min Zoom Level
It is possible to configure layers to only appear between specific zoom levels. The Min Zoom Level specifies the zoom level that the layer should start appearing.
Max Zoom Level
It is possible to configure layers to only appear between specific zoom levels. The Max Zoom Level specifies the zoom level that the layer should stop being visible.
Min and Max Detail Zoom Level
Not available with WebGL rendering
Vector tile sources may not contain tiles for every level of zoom. Setting the min and max detail levels means that for layers outside the min and max values, either the min detail zoom level's tiles will be used when zooming out, or the max detail's zoom level will be used when zooming in. Vector tiles will be scaled based on the detail available at those levels.
If the min and max zoom levels are configured beyond the available tiles, then no tiles will be shown at those zoom levels.
Visible
It is possible to set whether a layer is visible or not using conditional formatting. Specifying a field or DAX measure that returns either "yes" or "no" will determine whether this layer is visible.
Z-Index
A number that determines the order that different map layers appear in. The larger the number, the nearer the foreground.
Labels Z-Index
Not applicable to WebGL rendering
A number that determines the order that different map layers appear in. This settings enables you to specify the z-Index that data bound labels for items in the vector tile layer appear at. The larger the number, the nearer the foreground.
Formatting Options
Formatting for Matched Shapes
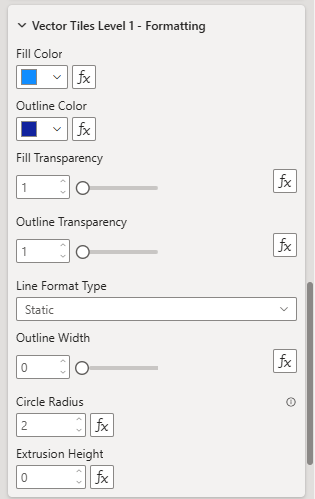
Fill color
The color for polygon fills.
Outline color
The color of polygon outlines or linestrings.
Fill transparency
Transparency of polygons. This should be a numeric value between 0 and 100.
Outline transparency
Transparency polygon outlines or linestrings. This should be a numeric value between 0 and 100.
Line Format Type
Only available with WebGL Rendering
Static - line width is the same at all zoom levels and can bve set with conditional formatting.
Based on zoom - line width varies based on the zoom level of the map:
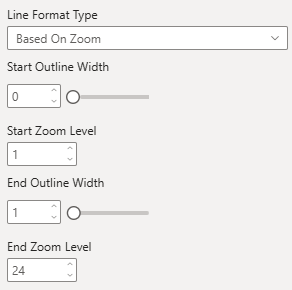
Start Outline Width - The width of the line in pixels at the zoom level specified by "Start zoom level" setting
End Outline Width - The width of the line in pixels at the zoom level specified by the "End zoom level" setting
Outline Width
Width of the outline in pixels. Can be a decimal number.
Circle Radius
The radius to draw circles for any point data within the vector tile layer.
Dash Array
Not available with WebGL rendering
The dash array determines the pattern used for the line. It consists of a series of space separated numbers. Each value represents the length along the line that should be painted (the dash) and then not painted (the gap). Eg:
4 4
Extrusion Height
Only available with WebGL rendering
The height in meters that a polygon is extruded from the map, to give a 3D appearance.
Fill Color
Fill color of a shape.
Fill Transparency
Transparency of the fill of a shape.
Formatting for Unmatched Shapes
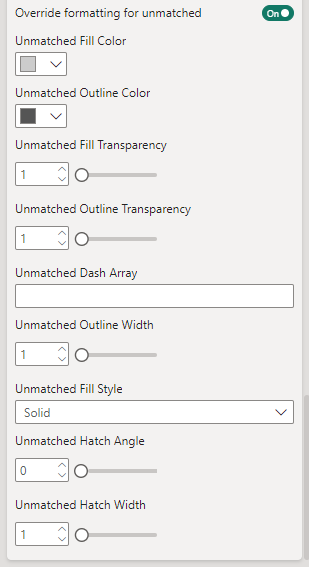
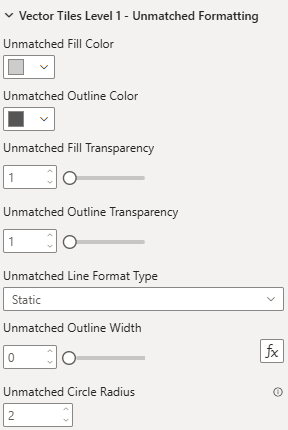
Unmatched Outline color
The color of shape outlines or linestrings.
Unmatched Outline transparency
Transparency shape outlines or linestrings. This should be a numeric value between 0 and 100.
Line Format Type
Only available with WebGL Rendering
Static - line width is the same at all zoom levels and can bve set with conditional formatting.
Based on zoom - line width varies based on the zoom level of the map:
Start Outline Width - The width of the line in pixels at the zoom level specified by "Start zoom level" setting
End Outline Width - The width of the line in pixels at the zoom level specified by the "End zoom level" setting
Unmatched Outline Width
Width of the outline in pixels. Can be a decimal number.
Unmatched Dash Array
Not available with WebGL rendering
The dash array determines the pattern used for the line. It consists of a series of space separated numbers. Each value represents the length along the line that should be painted (the dash) and then not painted (the gap). Eg:
4 4
Unmatched Fill Color
Fill color of a shape.
Unmatched Fill Transparency
Transparency of the fill of a shape.
Unmatched Circle Radius
The radius to draw circles for any point data within the vector tile layer.
URL Formats
GeoServer
The URL for GeoServer's GeoWebCache WMTS service could similar to the URL below:
https://my.geoserverwebaddress.com/gwc/service/wmts?REQUEST=GetTile&SERVICE=WMTS&VERSION=1.0.0&LAYER=iconmap:LAD_DEC_2022&STYLE=&TILEMATRIX=EPSG:3857:{z}&TILEMATRIXSET=EPSG:3857&FORMAT=application/vnd.mapbox-vector-tile&TILECOL={x}&TILEROW={y}
Mapbox
To determine your URL for Mapbox tilesets, within Mapbox Studio, navigate to preview your tileset within the Data Manager.
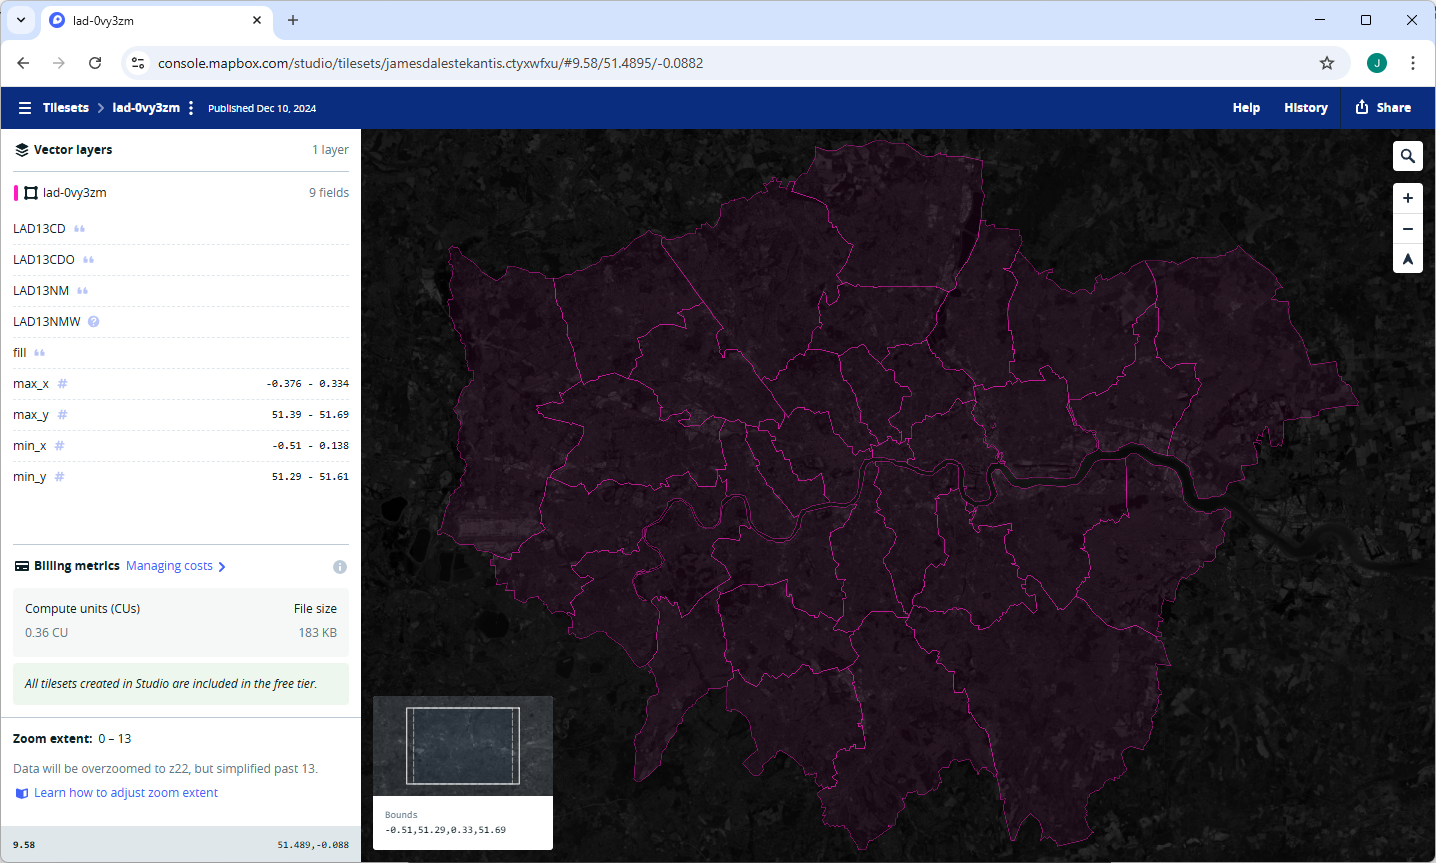
and click the Share icon in the top right hand corner and copy the tileset ID:
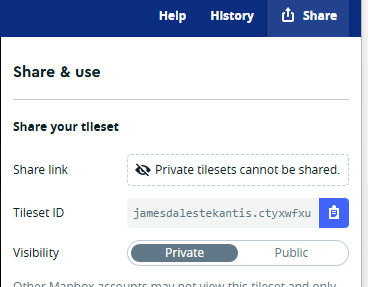
Substitute {tilesetID} with it in the following URL:
https://api.mapbox.com/v4/{tilesetID}/{z}/{x}/{y}.vector.pbf?access_token={MapboxAccessToken}
Also substitute {MapboxAccessToken} with your Mapbox key.
ArcGIS
Navigate to the Tile layer within the ArcGIS Location Platform. There should be a URL for the tile layer provided:
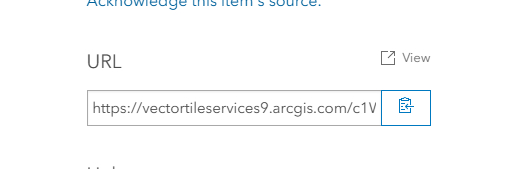
Copy this URL which will look similar to:
https://vectortileservices9.arcgis.com/c1W33XRwDAsMveG5/arcgis/rest/services/LSOA_21_Tiles/VectorTileServer
Add
/tile/{z}/{y}/{x}.pbf
to the URL to result in a URL such as:
https://vectortileservices9.arcgis.com/c1W33XRwDAsMveG5/arcgis/rest/services/LSOA_21_Tiles/VectorTileServer/tile/{z}/{y}/{x}.pbf
If you are using user or 0Auth2 authentication with ArcGIS, then enable the "Source is ArcGIS" toggle. If you are using API key authentication this needs to be added to the URL by substituting {ArcGIS Token} with your API Key:
https://vectortileservices9.arcgis.com/c1W33XRwDAsMveG5/arcgis/rest/services/LSOA_21_Tiles/VectorTileServer/tile/{z}/{y}/{x}.pbf?token={ArcGIS Token}
PMTiles
The PMTiles URL should be the path to the file.
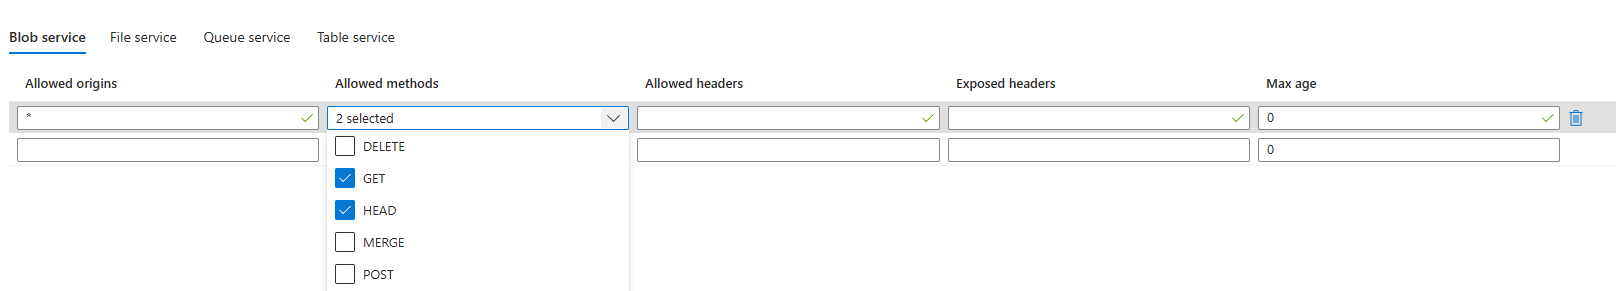
To host in Azure storage, ensure that the storage account is configured for CORS:

by configuring the Allowed origins as * or null and selecting GET and HEAD as allowed methods:
The file URL can be found by locating the URL for the file within the storage container:
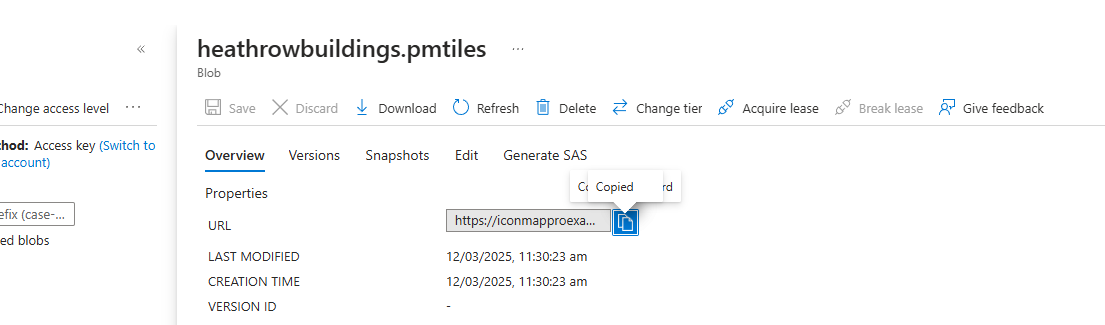
For example:
https://iconmapproexamples.blob.core.windows.net/examples/heathrowbuildings.pmtiles
The blob or container must either be configured for anonymous access, or alternatively you can configure a Shared access token for restricted access:
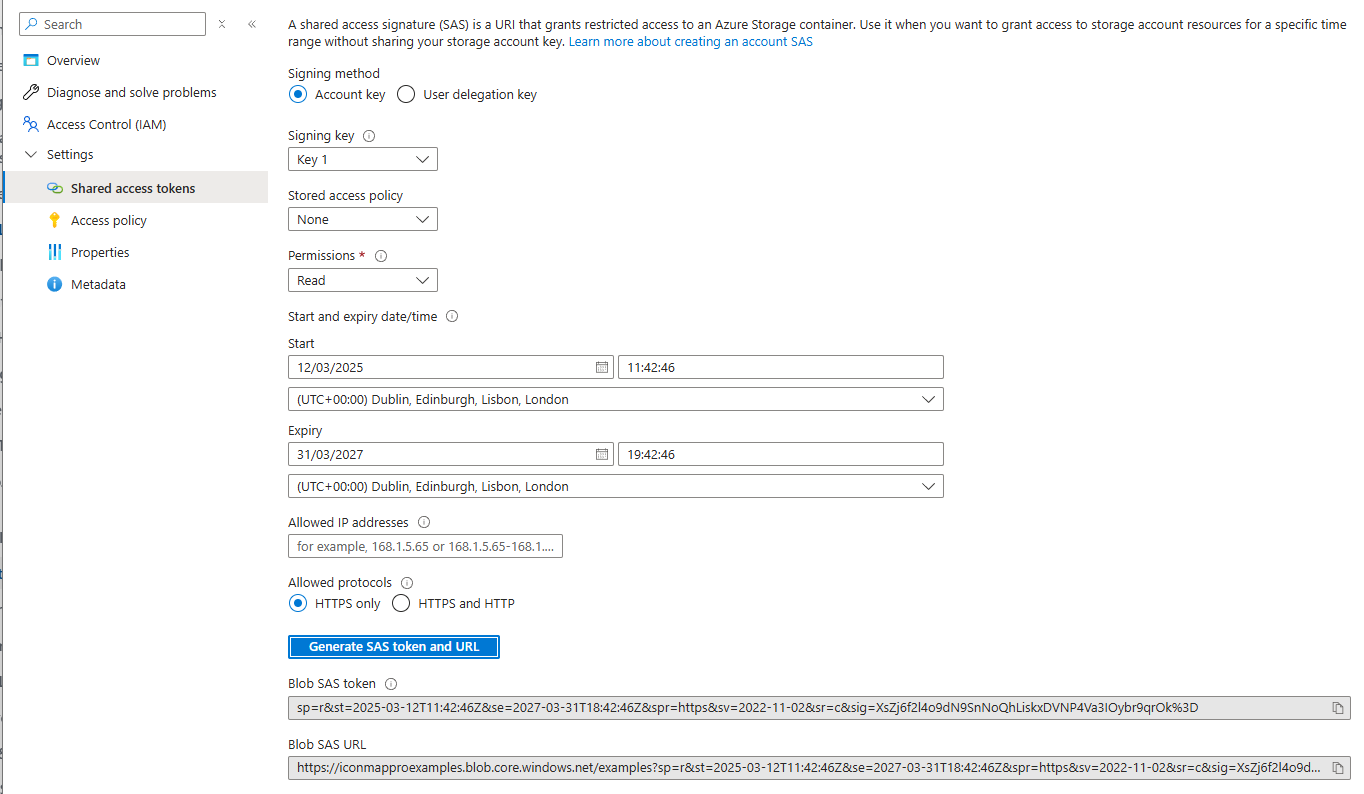
The Blob SAS URL should be used in Icon Map Pro. E.g.
https://iconmapproexamples.blob.core.windows.net/examples?sp=r&st=2025-03-12T11:42:46Z&se=2027-03-31T18:42:46Z&spr=https&sv=2022-11-02&sr=c&sig=XsZj6f2l4o9dN9SnNoQhLiskxDVNP4Va3IOybr9qrOk%3D
You can find a step by step guide to creating PMTiles files in our blog.