Formatting & Configuration
Accessing the configuration options
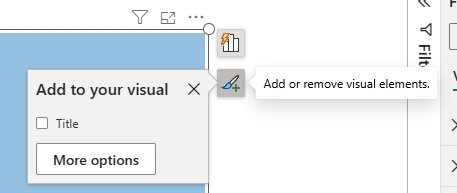
Once you have dragged in some data fields to the visual, you will be able to configure the map. To do this, click on the visual to select it.
Depending on your Power BI setup, you may need to click the formatting icon, and then click the "More options" button:
which will display the formatting options on the side of Power BI Desktop:
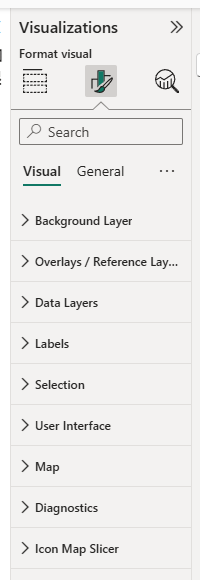
Configuration option categories
Background Layer
This determines the background map. A range of customizable background map styles are included with the visual hosted by Tekantis.
Overlays / Reference Layers
Overlays and reference layers are generally static layers which don't provide interaction options for the user. They provide additional context over the background map.
Data Layers
Data layers are the objects drawn on the map that are sourced or linked to the Power BI data. They can be selected and filtered and formatted based on Power BI data.
Labels
Many items in the data layers also allow attaching a text label to them. This section allows configuration of data-bound labels.
Selection
The selection section determines the configuration of how items are selected and filtered by Icon Map Slicer.
User Interface
These are the interactively options for controlling and understanding the map. They include the zoom controls and scale.
Map
These options control the whole map and include zooming, limiting the map to a specific area, the default start position, and animation.
Diagnostics
Displays how Icon Map Slicer interprets the data displayed on the map, and can be useful for understanding what's happening when items aren't appearing or being displayed as expected.
Icon Map Slicer
Contains information about the visual such as the version number, debug information to assist support, and configuration of the license key for environments that don't support user based licensing such as when embedded in a custom web portal.